
 Ελληνικά
 Polski
 Slovak
 Español
 Lietuvių
 Português
Track and measure Analytics
Right, you have reached lesson 3! You are now ready to track and measure analytics! We will do so by understanding what metrics and dimensions are, as well as discovering their various forms. It is highly recommended that from now on you use an analytics tool like “Google Analytics” to facilitate your learning process![1]
Metrics
A metric is essentially anything you can count. For example “Time Spent On Site” or “Unique Visitors”. If you sell products on your website, you can monitor how much profit you are making or how many products you are selling. If your goal is to get people to visit your Facebook account, you can track the number of times someone shared your posts or the amount of ‘likes’ you get to see which posts were most successful. All of these things are metrics.
Metrics give a lot of information but you need what are called dimensions to analyze them and get answers for your questions.
There are many ways to classify metrics, we will use Google Analytics as it is the free tool currently used by most companies. This classification is transferable to other tools.
There are 3 three categories for metrics, acquisition-related metrics, behaviour-related metrics and conversion-related metrics: how visitors completed conversion on your website.
Acquisition-related metrics
Acquisition related metrics refers to how visitors arrive to your website. These include:
- Users: Measures unique visitors to your website.
- New Users: Measures visitors that never been to your site before and are initiating their first session on your site.
- Sessions: Measure the volume of visits to your website.
As you can see in the following figure, you can visualize the number of users, new users and sessions that arrived at your website from different channels, e.g. Direct, Paid Search or Organic Search.
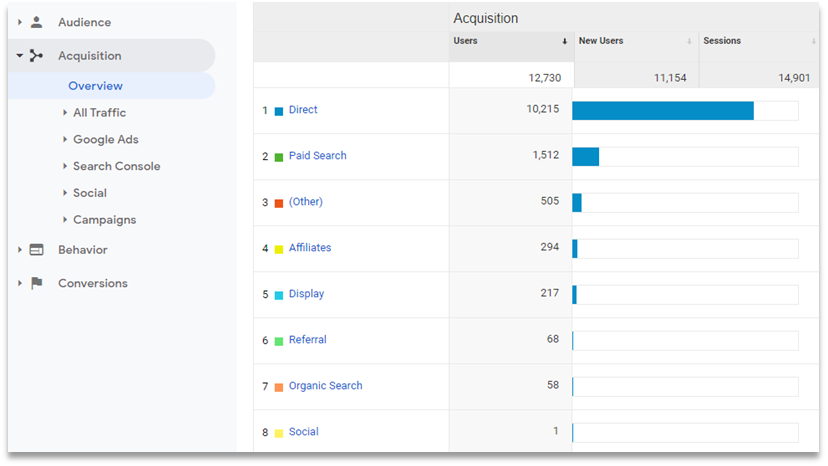
Source: Own account of Google Analytics
Behaviour-related metrics
Behaviour-related metrics refers to how visitors interacted with your website, including:
- Bounce Rate: Measures the percentage of sessions that leave your website without taking any additional action
- % Exit: Measures the rate at which visitors leave your website from specific pages.
- Pages/Session: the average number of pages viewed during a session on your website.
- Session Duration: Measures the amount of time (on average) users spend on your website.
As seen in the following figure, you can track your visitors behaviour in your different pages of your website.

Source: Own account of Google Analytics
Conversion-related metrics
Conversion-related metrics refers to how visitors completed conversion on your website. These metrics are:
- Ecommerce conversion rate: The ratio of transactions to sessions, expressed as a percentage. For example, a ratio of one transaction to every ten sessions would be expressed as an Ecommerce Conversion Rate of 10%.
- Transactions: is made up of the information collected about each transaction that occurs on your site or app.
- Revenue: Specifies the total revenue or grand total associated with the transaction.
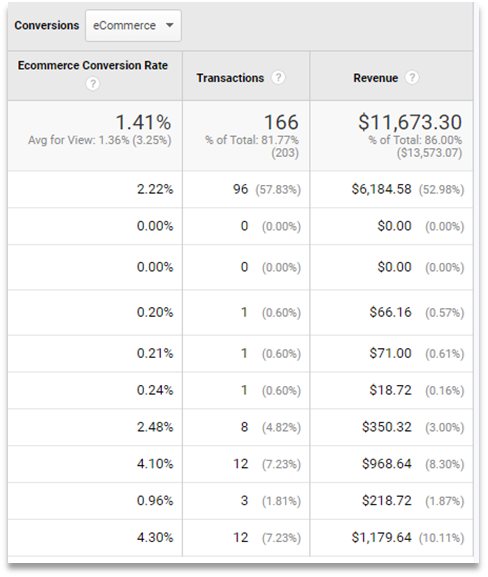
Source: Own account of Google Analytics
Is this too much information? Go now to Google analytics and put this into practice! https://analytics.google.com/analytics/web/#/report-home/a54516992w87479473p92320289 If you don’t have a website yet, Google offers you a demonstration account that you can use to test your skills!
Dimensions
Have you tested the different metrics on Google Analytics? Let’s then move on to the dimensions. In simple words, a dimension is any kind of data you can use to describe something you are tracking with words, this will include device type, browsers used and geographic locations, among others. We can find 4 levels of dimensions.
Hit Level dimension
It is the dimension that has got hit level scope. Following are the examples of predefines hit level dimensions: Page, landing page, search term, event category, event action or label.
Session level dimension
It is the dimension that has got session level scope. Following are the examples of predefined session level dimensions: Source, keyword query.
User level dimension
This is the dimension with user level scope. Examples are: age, gender, affinity category, country, region and city. The next figure, shows the different metrics previously learnt by age groups.

Source: Own account of Google Analytics
Product level dimension
It is the dimension that has got product level scope. Following are the examples: Product, category, brand, transaction ID, or product list name.
Understood? Then, you are ready to find answers to questions for your Start-up such as What time of day most people are visiting your website? Take your “Visitors” metric and break that down by an “Hour of Day” dimension.
[1] https://support.google.com/analytics/answer/1033861?hl=en